With December coming and going yet again, we’ve come to a new month AND a new year! To celebrate, we’ve put together our monthly Market Report — yes, we do find it exciting — so put your party hat back on and take a moment to review the year 2011 in local real estate statistics.
November was a fairly strong month for the Harrisonburg area in terms of real estate, but did show a slow-down due to the holidays setting in. The year finished off with strong sales and a great year-to-date contracts upswing!
[Click any image below to view larger version]
Sales increased from 2011 over 2010 by 4.4%! This shows us that over the past 12 months, buyers have been buying… and more often than the year prior. Those buyers also got more “bang for their buck” because sales prices were down, thus bringing down the average price per square foot (by 7.9%, to be exact). Although home values are down, the fact that sales increased is a good sign that our local market is bouncing back a bit.
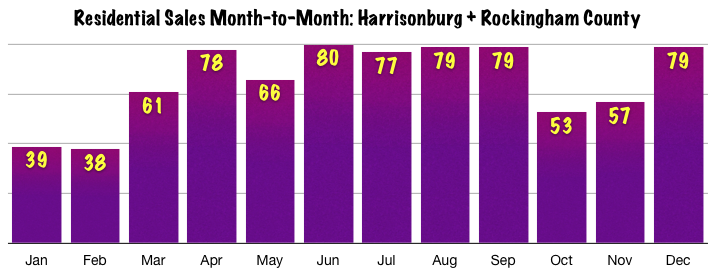
Above, you can see how sales ebbed and flowed throughout the year. December finished strong with 79 total residential sales, which matches August and September, and even beats out April, which is typically a strong month as well!
Lets take a look at contracts. Though contracts decreased by 20 from November, they increased over the year by over 20%! So not only did sales increase over 2010, but contracts did as well. Another sign of healing in our Harrisonburg real estate market.
And here you can see how contracts fared over the past 12 months. December was indeed the lowest month for contracts in 2011, but this is typical because most buyers put their home searches on the back burner over the holiday season. We hope to see an uptick in contracts this month, but only time will tell.
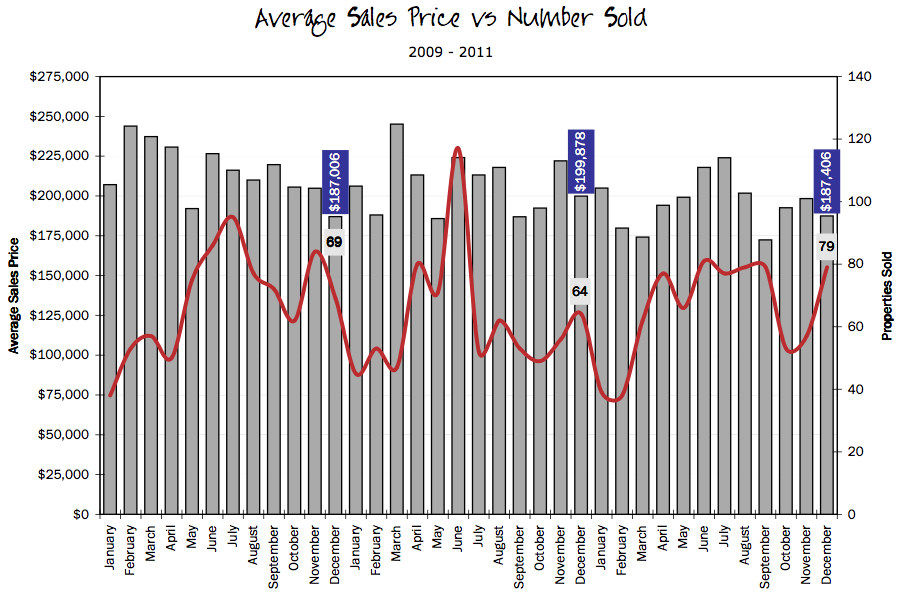
The above chart shows the number of properties that have sold over the past 3 full years, and each month’s respective average sales price. The December numbers are highlighted. 2011 sales are higher than both 2009 and 2010 sales, and average sales price fell between the two previous years.
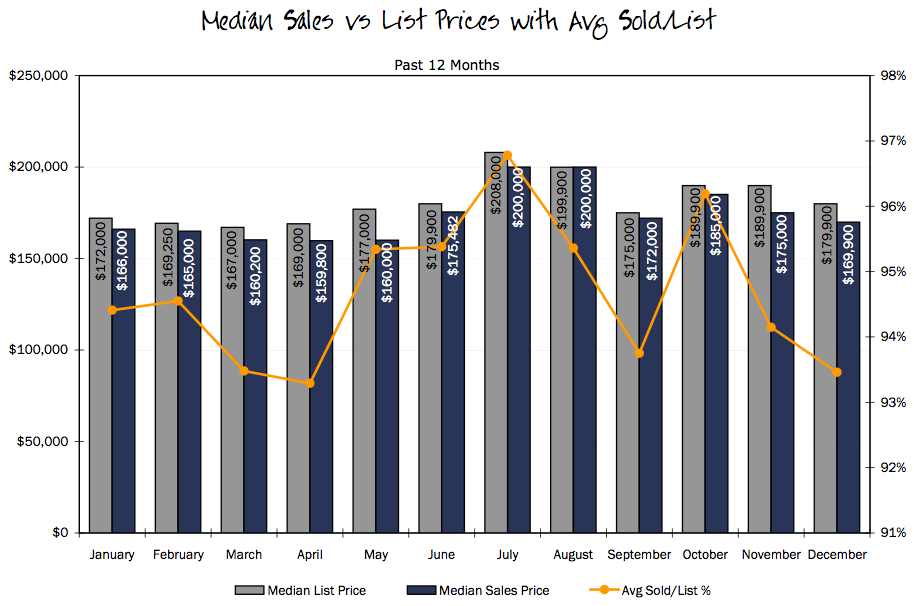
The graphic above shows us the median list and sold prices over the past 12 months, with the orange line depicting the average sold/list percentage. In simpler terms, the average sold/list percentage tells us how much the seller got as a percentage of the final list price. For example, if Mr. Smith listed his home for $250k and sold it for $210k, his sold/list percentage would be 84% (210,000 divided by 250,000). Back to the graph above, it looks like sellers were listing around $180k and selling for $170k.
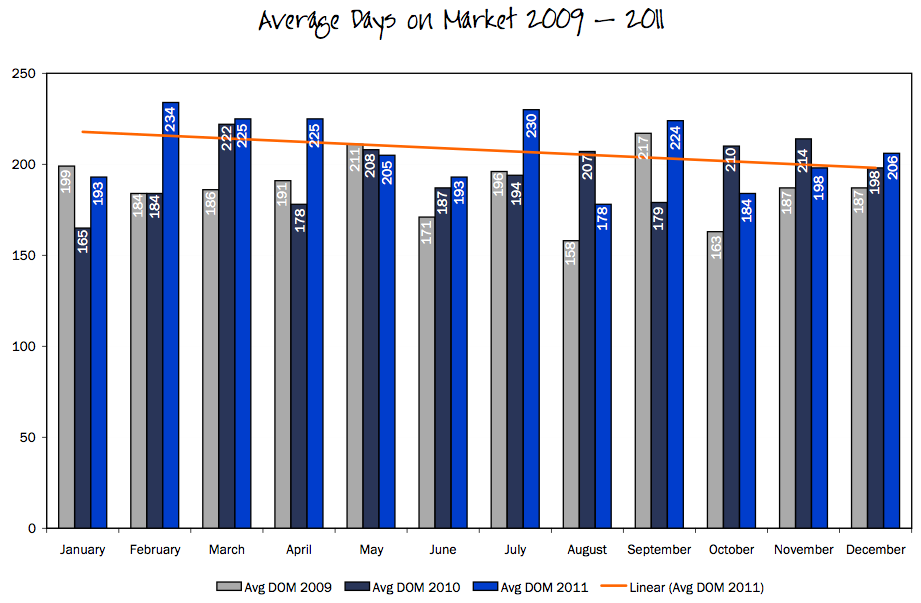
Days on market plays a role in pricing. If a seller wants to sell quickly, the price has to be aggressive (or at least priced reasonably well). The average DOM in Harrisonburg and Rockingham County in December was 206 days. As you can see, DOM for 2011 has been higher during most months this year than in the previous two. Buyers are buying, but houses are sitting on the market for a longer duration. Perhaps buyers are able to be more picky? This brings us to supply and demand…
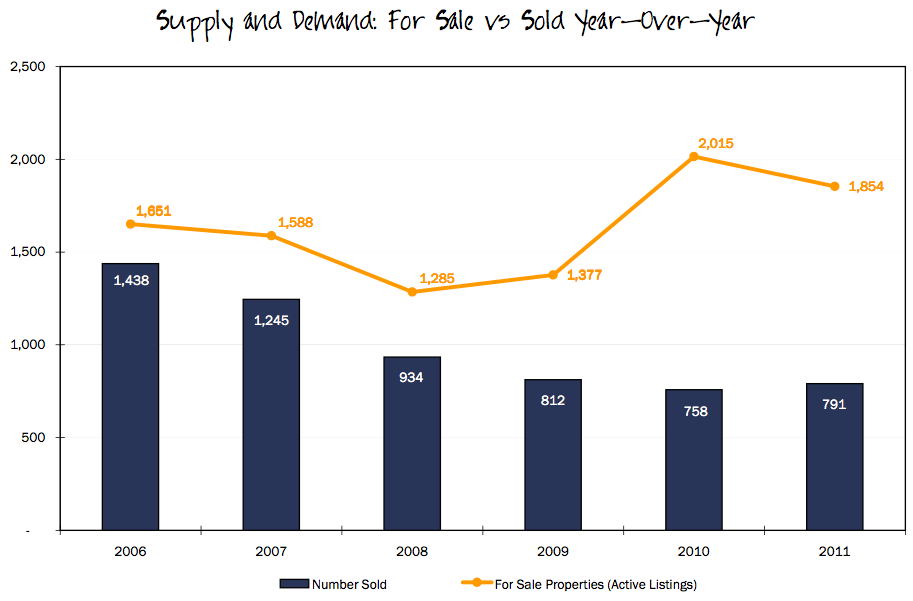
Supply and demand is a basic economics concept. Supply, in this case, is the number of homes for sale (active listings), and demand is the number of homes that sold. In 2011, there were 1,854 active residential listings, and 791 homes sold. That is a lot of supply for a small amount of demand (though it is a bit better than 2010 was). Buyers can be more picky, because there is an overwhelming amount of homes to choose from in our local market.
To recap, we’re celebrating because sales are up, contracts are strong, and the future is bright.
In the next week, we will be showing you some more year-over-year statistics regarding the Harrisonburg and Rockingham County real estate market. (We provided you with a lot of info here, and didn’t want to overwhelm you too much!)
And as always, stay tuned for our next Market Report, right here on Harrisonblog…




Pingback: Harrisonburg Area Real Estate Market Report: January 2012
Pingback: A Closer Look at Harrisonburg’s 2011 Real Estate Market
Excellent post Lisa – thanks for the wealth of information and graphs. This year I am confident we will see further improvement in our local real estate market.